
RETROSPECTIVE
How designing a client feedback process at Goldman Sachs led me to design school
Before pivoting to design, I spent 7 years working at investment bank Goldman Sachs. Throughout my career, my focus shifted from marketing to informatics, where I developed dashboards to assist salespeople in data analysis. As part of a regulatory change preparation process, I was transferred to the in-house consulting team to review client feedback information processes and strategies.
The project unexpectedly led me to design a digital product, revamp business processes, and build a small team. This experience motivated me to equip myself with the right tools and framework for innovating products and services. Here is a retrospective of the project that prompted me to pursue an education in design, and what I would have done differently now.
Strategic Design
Jul 2017 - Feb 2019 | 1.5 years | Goldman Sachs
MY ROLE
Stakeholder & Project Management
User Research
Information Architecture
UI Design
Development (Qlik - SQL & C++)

BRIEF
Improve client feedback process through design and strategy
Background
Goldman Sachs (GS) is a financial institution that provides various financial services to individuals, corporations, and governments.
The sales and trading function is responsible for generating investment ideas and trading for institutional investors such as pension funds and hedge funds.
Sales use information from the research department to generate investment ideas for clients, and traders place and execute orders on behalf of clients. Commissions are generated whenever a trade is placed and are split between sales and traders.
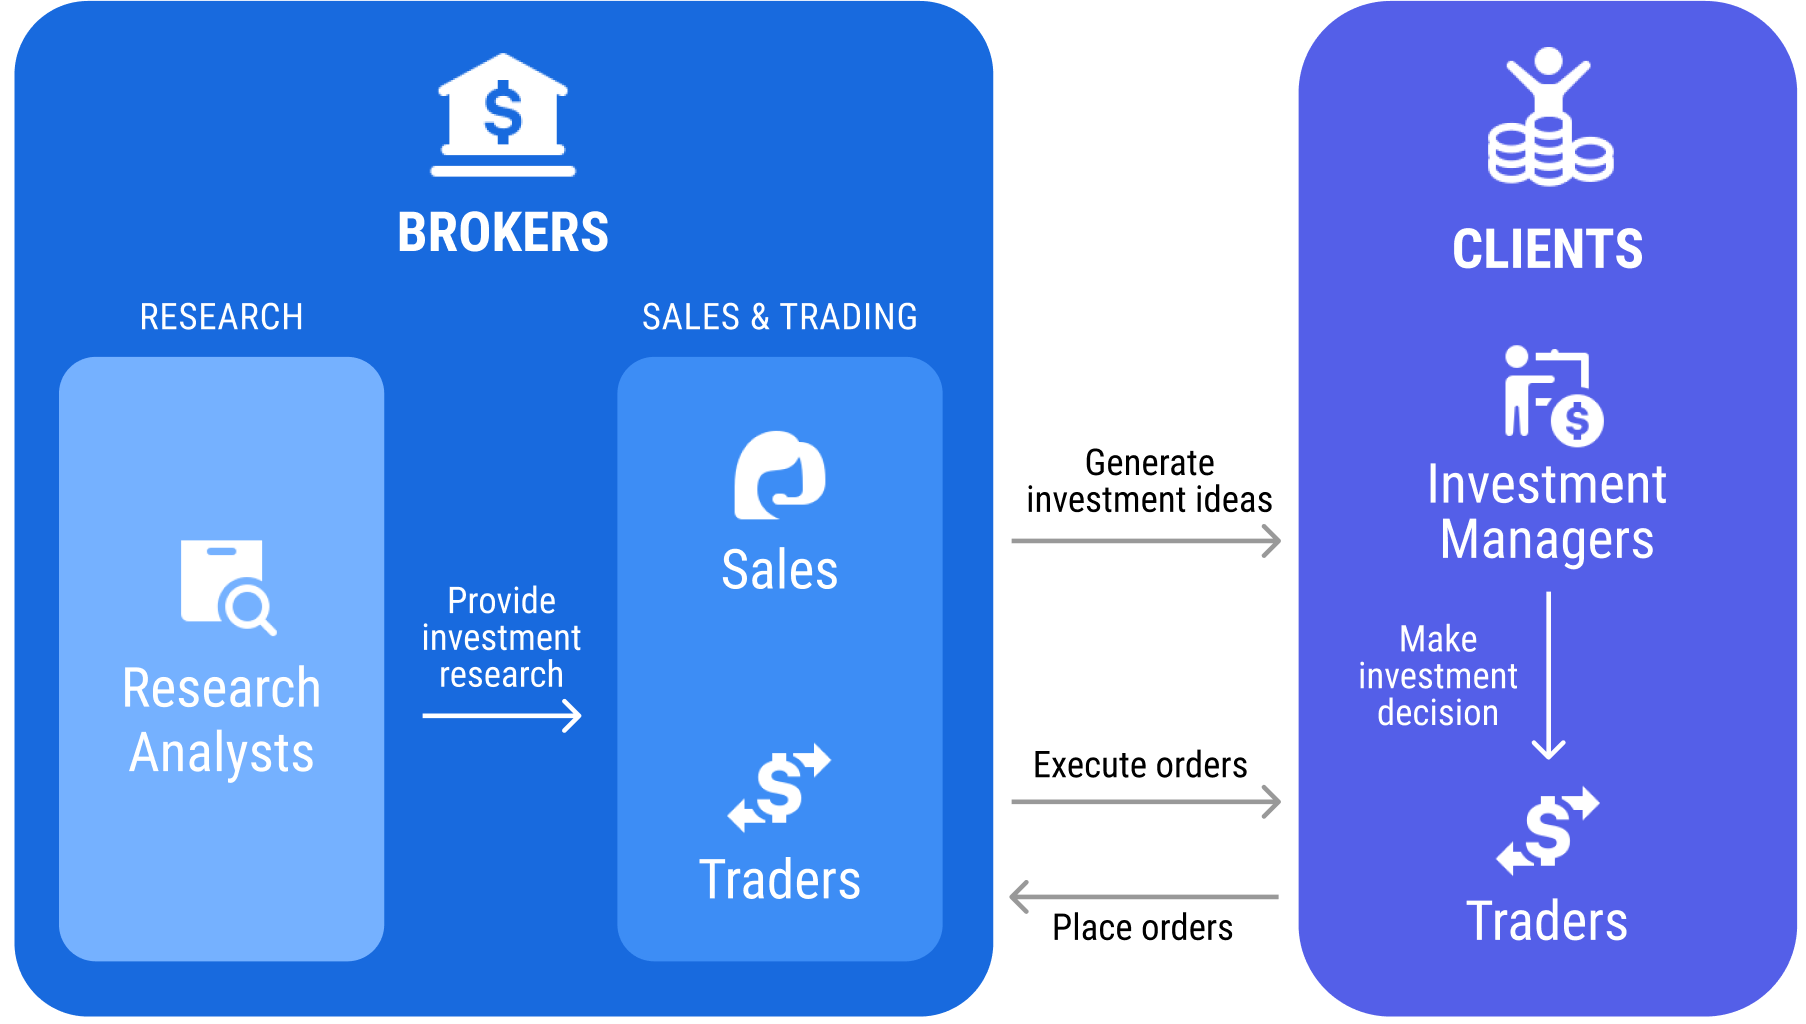
What is a Broker Vote?
Brokers sometimes get commissions based on a process known as a ‘broker vote’. Imagine a classroom full of students. Each student gets a piece of a cake based on how their teachers rank them. Students who perform well get more cake, while those who perform poorly get tiny pieces or no cake.
Broker vote is kind of like that — clients provide feedback for brokers, and their rankings determine how much commissions brokers get through trading activities. Each client has its own evaluation criteria and process.


The Challenge
In the past, only a few clients had a formal broker vote process. A new set of regulations introduced in 2018 required commission payments to be more transparent, making the broker vote process a necessity for most clients.
As a result of this change, broker votes would need to be monitored closely as they directly impact how much commissions are paid. However, the understanding of broker votes was poor because of the existing fragmented information and process. I was tasked to review the operational processes and overall strategy related to broker vote information.
Even though I had some experience with broker vote from my previous role, the scope was limited to data analysis for specific clients. I mapped out a list of stakeholders and drew up questions on how the broker vote process fits into their roles and business operations:
Coverage team — sales, traders, and their managers
Leadership — partners who oversee and run the organisation
Management & Strategy team (my new team) — the team who supports leadership on business operations and strategy
Based on the information gathered from my meetings, I summarised the needs and challenges of each stakeholder group and created a process map to show how the broker vote information flows through different groups.
Research

⏳ Looking Back, I Would Have…
…prepared a research plan ahead of my meetings and conducted the interviews in a more structured manner
…created a system map illustrating how components are connected, especially in terms of the values they exchange
…built personas for each stakeholder group to capture differing behaviours
Stakeholder map
Interviews
Process map
Stakeholder map
Research plan
Interviews
System map
Personas
Design Opportunities
Through speaking to different stakeholders, I identified three potential areas for intervention:
Understanding
Limited information collected and fragmented process from clients made it difficult to understand how broker votes affect commissions
Visibility
The incentive gap around sharing unfiltered feedback sometimes caused a disconnection between feedback given and feedback received by the leadership team
Accountability
The inability to systematically monitor broker votes and measure client performance at a firm level led to weak accountability for the coverage teams
How might we increase accountability around broker votes by improving understanding and visibility of broker vote information?
Ideation
Having decided on the design challenge, I mapped each opportunity area to a potential operational intervention:
Understanding — what if we could collect information systematically?
Visibility — what if we could share impartial broker vote information?
Accountability — what if we could observe how we are doing with clients holistically?
Focusing on how we could monitor broker votes consistently, I hosted a few Show & Tell sessions with stakeholders to review the dashboards I had built in my previous role and explored what features would be useful.
⏳ Looking Back, I Would Have…
…conducted workshops to brainstorm ideas with stakeholders to explore more ideas rather than jumping straight to solutions
…incorporated card sorting activities during my show & tell sessions to uncover users’ mental models for better information architecture
Show & Tell
Brainstorming workshops
Show & Tell
Card sorting
After the show-and-tell sessions, I gathered requirements from stakeholders and began planning the new dashboard's information architecture and visual hierarchy. Colour palette, typography, and grid pattern were based on the firm's style guide.
The ‘What’: I grouped all the data requirements into different categories based on the relationships between them
The ‘When’: Based on the availability of data and the difficulty of coding implementation, I categorised the data requirements into different phases
The ‘How’: I made sketches to visualise the content and how the dashboard might look at different phases
This process was not a single iteration process as I had to account for the availability of information and continual feedback from leadership. As the sole developer, I was also constantly assessing how difficult it would be to implement the dashboard due to my lack of engineering experience.
Prototyping
Early prototype

Making data visible
As we were building up the data repository, information was displayed in snapshots in lieu of historical data.
Mid Prototype

The latest trend
With more data becoming available, a filter was created so that stakeholders can explore the data in different cuts. Time-series information was added to show the latest trend.
Final Outcome

Creating a Loop
Different tabs were created to allow stakeholders to explore data in a more detailed view. Reminders were created based on previous review dates for the coverage team to schedule client reviews if they were overdue.
⏳ Looking Back, I Would Have…
…created some low-fidelity mock-ups and concept walkthroughs to gain feedback in the early stage
…written up user scenarios to describe how users may use it in specific contexts
…conducted regular user testing to validate, test ideas, and iterate quickly
Low-fidelity prototype
Concept walkthrough
User scenarios
Experience prototype
User testing
Sketches
Experience prototype
We implemented the system in phases which included changing processes, developing the dashboard, and incorporating information into broader business strategies.
Outcome
Data collection and dissemination
To improve client feedback, the leadership team now gets direct feedback from clients instead of the coverage team. We developed a questionnaire that collects a set of standardised information to ensure the dashboard's data integrity. Review results were shared by the management & strategy team with the entire coverage team (sales and traders) regardless of functionality to encourage collaboration between teams.


Tracking
The dashboard allows stakeholders to explore broker vote data for different clients at any time. A weekly meeting was established with senior leadership to summarise feedback received from clients and prepare for upcoming reviews.
Broader Strategy
This project and additional regulatory reporting requirements highlighted the importance of client data. I created a business case and helped build a global data team to support the process and strategy around client data.

Awareness
The number of clients actively tracked increased by 12 times from 25 to 180+.
With more information collected, we were able to establish a much better understanding of how clients vote and monitor client feedback holistically.
Impact
Accountability
By changing the data collection process, senior leadership was able to get unfiltered client feedback on the coverage team.
The data collected was eventually incorporated into the coverage team’s annual performance and compensation process.
Scalability
The dashboard became a model for a web-based application for the broader organisation which I helped develop with the engineering team.
Key Takeaways
🙂 What Worked Well
Design with Context
Components in the service ecosystem were designed in the context where they were interlinked, which was helpful for the planning and execution of the project.
Engagement
Active engagement from stakeholders helped create a constant feedback loop, allowing me to iterate my design to fit their needs.
🤔 What Could Have Improved
Working with a Team
It was very challenging to develop and execute a project alone for 1.5 years, especially splitting time between attending client reviews and implementing the dashboard at the same time.
Design Methodology
The lack of knowledge of design methodology at the time prevented me from allowing space to explore, brainstorm, and prototype.